From Visual Capitalist - Decarbonization
The following content is sponsored by the National Public Utilities Council
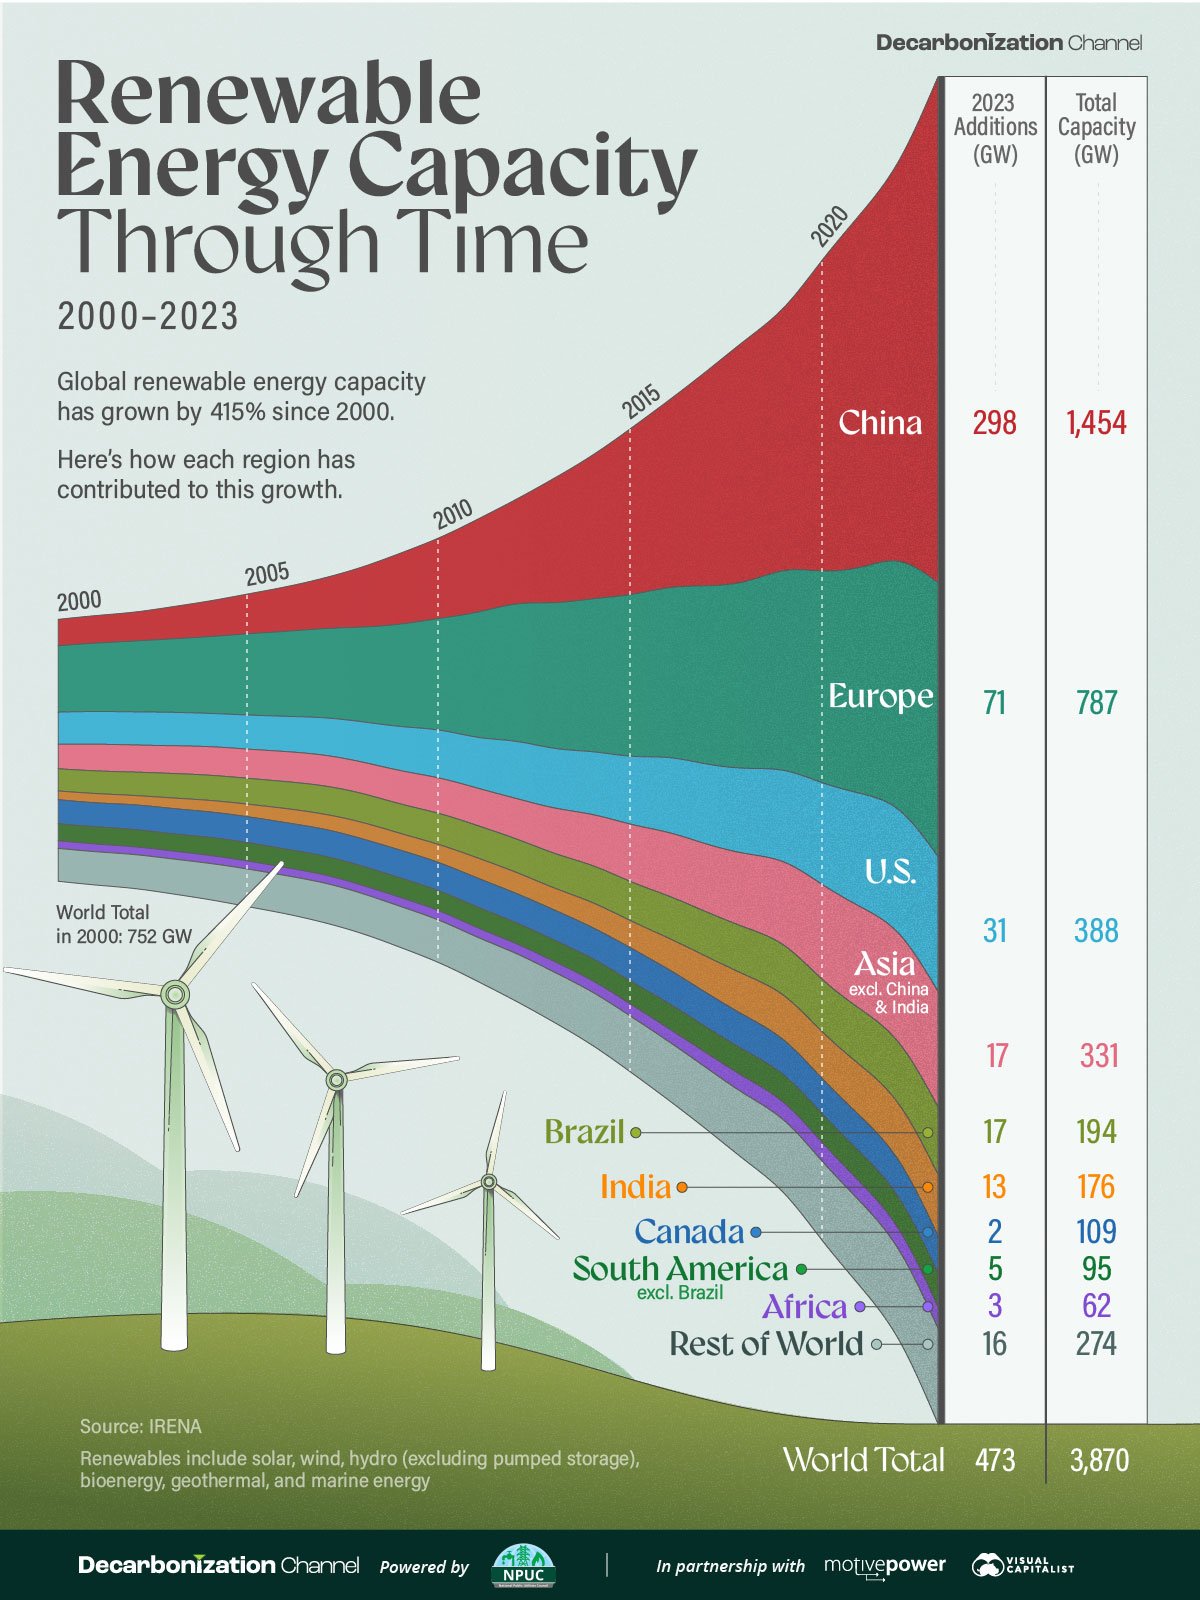
Visualized: Renewable Energy Capacity Through Time (2000–2023)
Global renewable energy capacity has grown by 415% since 2000, or a compound annual growth rate (CAGR) of 7.4%.
However, many large and wealthy regions, including the United States and Europe, maintain a lower average annual renewable capacity growth.
This chart, created in partnership with the National Public Utilities Council, shows how each world region has contributed to the growth in renewable energy capacity since 2000, using the latest data release from the International Renewable Energy
[...]
Read the full post at Visual Capitalist - Decarbonization.