Summary
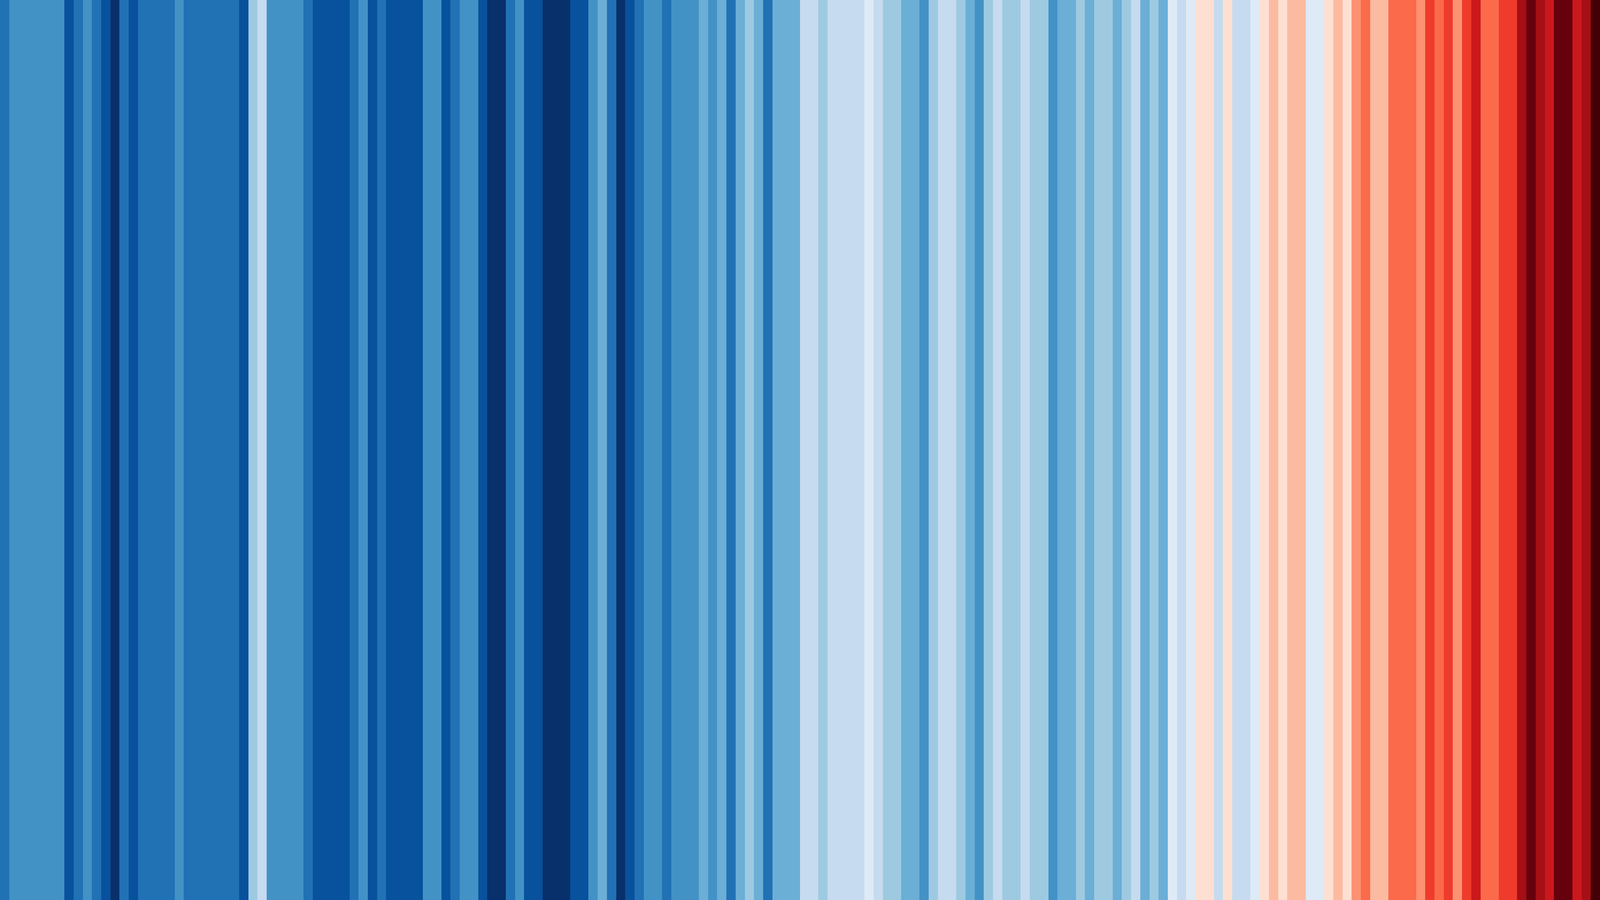
- The “warming stripes” visualization was created by climate scientist Ed Hawkins to represent temperature anomalies over the past 100+ years, with blue shades indicating cooler temperatures and red shades representing warmer temperatures.
- Global temperatures have been on the rise, with 2023 being the hottest year on record at 1.48C warmer than the pre-industrial level, leading to an update in the warming stripes to accommodate the record-breaking temperature.
- The burning of coal, natural gas, and oil for electricity and heat is the largest source of global greenhouse gas emissions and the primary driver of global warming, emphasizing the importance of reducing carbon emissions globally.
June 21, 2024 marks the seventh annual Show Your Stripes Day – an event dedicated to growing global awareness about human-caused climate change and turning the climate conversation into action by using and sharing the famous “warming stripes” visualization using the hashtag #ShowYourStripes. But how did these stripes originate and what is the real meaning behind them?
—
Created by climate scientist Ed Hawkins, the “warming stripes” are visual representations of annual or monthly temperature anomalies for a specific location or region over the past 100+ years. The visualization uses a color scale to represent temperature deviations from a baseline average, typically spanning several decades.
In the warming stripes visualization, each stripe or bar represents a single year or month, and the color of the stripe represents the temperature anomaly for that specific time period. Blue shades indicate cooler temperatures or negative anomalies, while red shades represent warmer temperatures or positive anomalies.
[…]
On June 21, 2024, Hawkins launched the seventh annual campaign ‘Show Your Stripes‘ – a day to encourage people around the world to replicate the powerful image and share it on social media using the hashtag #ShareYourStripes.


