From Visual Capitalist
Global CO2 Emissions by Income Group
From a historical perspective, the current demand for natural resources has surged to unprecedented levels and continues to escalate—for both essential needs like food, clothing, water, housing, infrastructure, and non-essential consumption in everyday life.
This surge has been accompanied by annual increases in CO₂ emissions. Consumption, however, differs radically depending on income.
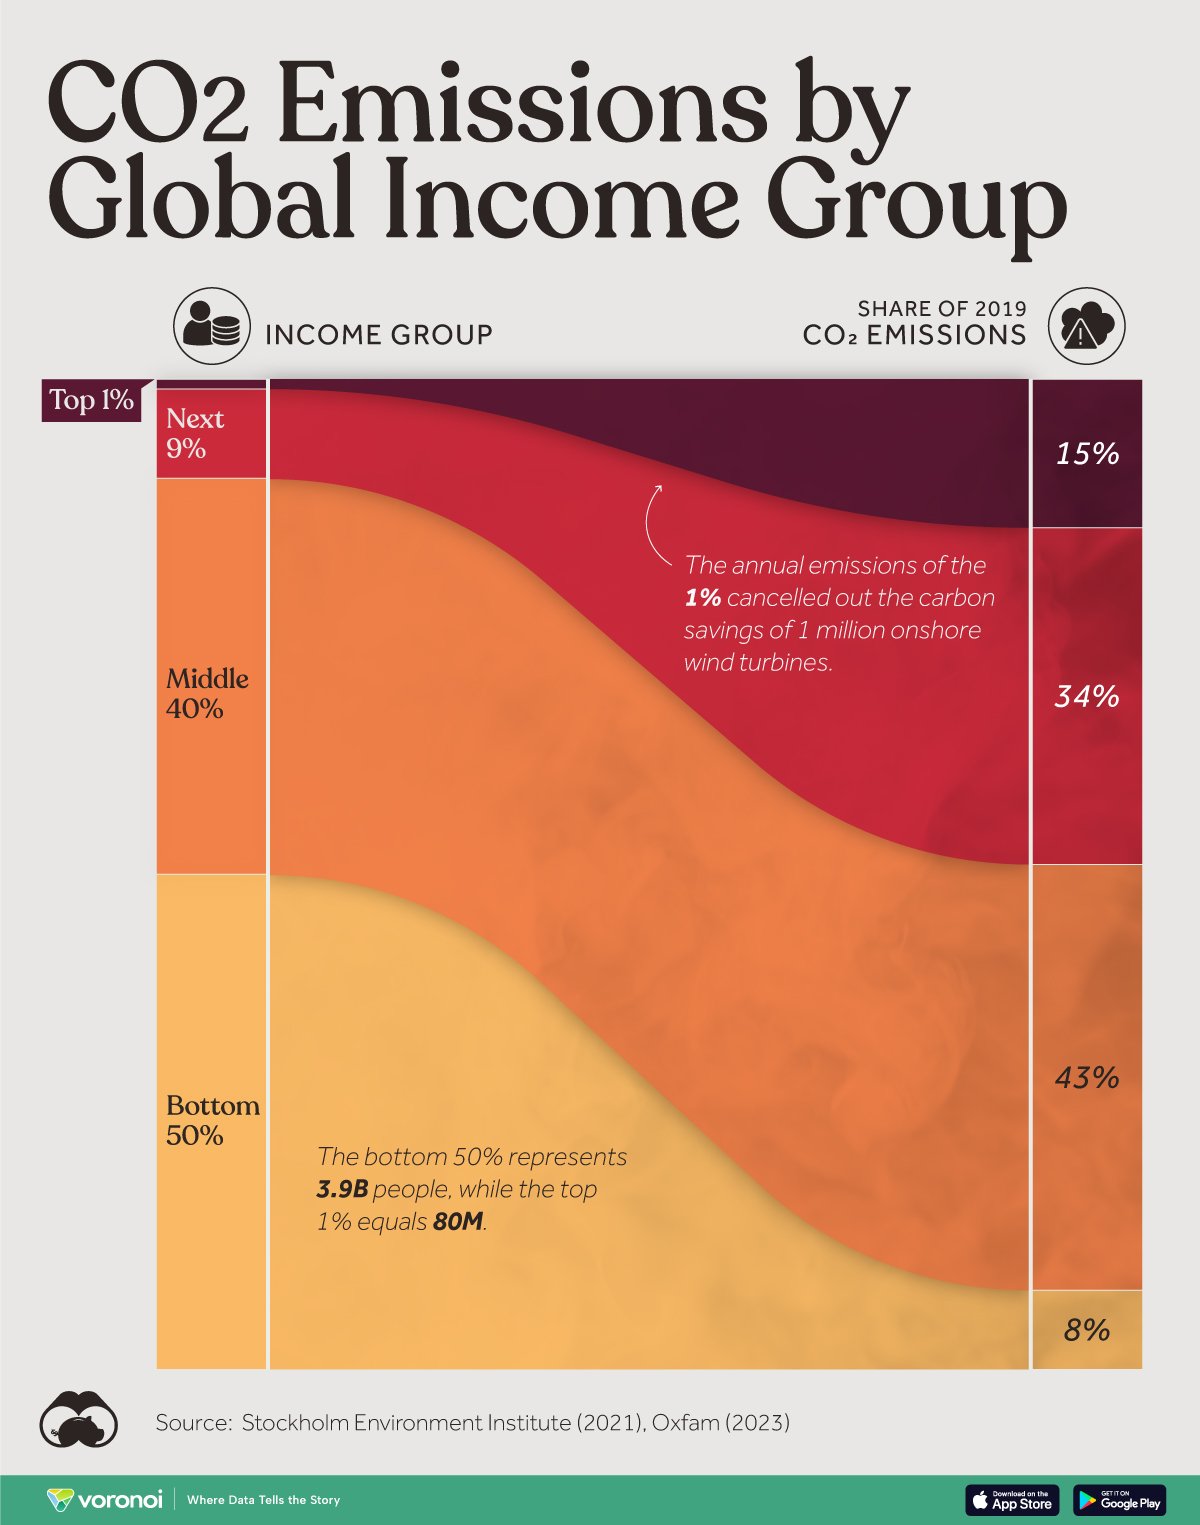
In this graphic, we visualize global CO₂ emissions in 2019, broken down by income group. This data comes from the Emissions Inequality Calculator, created by the Stockholm Environment Institute.
Wealthier Families Contribute More to CO₂ Emissions
In 2019, the world’s richest 1% (with an average income of $310K) were responsible for 15% of global CO₂ emissions.
The annual emissions of the 1% in 2019 canceled out the carbon savings of 1 million onshore wind turbines. In contrast, the bottom 50% (with an average income of $2,000) were responsible for only 8% of CO₂ emissions.
[...]
Read the full post at Visual Capitalist.