Gridlock: Visualizing the U.S. Clean Energy Backlog

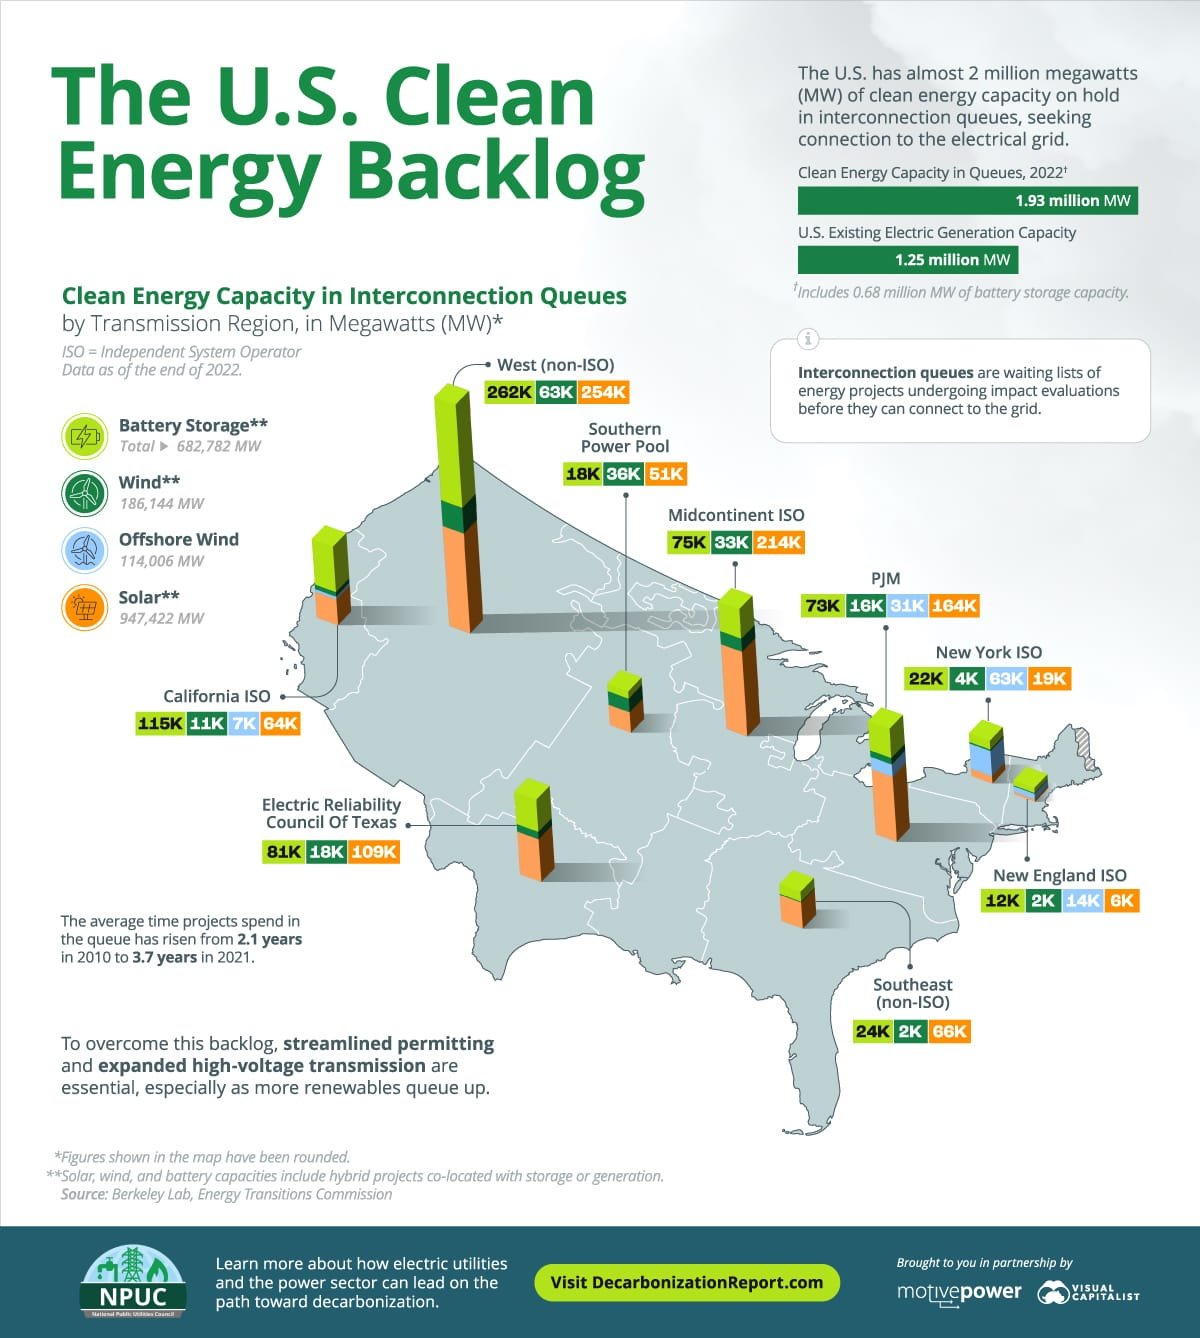
From Visual Capitalist - Decarbonization The following content is sponsored by the National Public Utilities Council Gridlock: Visualizing the U.S. Clean Energy Backlog The U.S. has almost 2 million megawatts (MW) of solar, wind, and storage capacity on hold in interconnection queues, seeking connection to the electrical grid. However, the lack of transmission infrastructure, in addition to a lengthy permitting process, has resulted in a bottleneck of clean energy projects awaiting approval before they can be plugged into the grid. This infographic sponsored by the National Public Utilities Council maps U.S. clean energy capacity in interconnection queues by transmission [...]Read
August 30, 2023

From Visual Capitalist - Decarbonization

The following content is sponsored by the National Public Utilities Council

Gridlock: Visualizing the U.S. Clean Energy Backlog

The U.S. has almost 2 million megawatts (MW) of solar, wind, and storage capacity on hold in interconnection queues, seeking connection to the electrical grid.

However, the lack of transmission infrastructure, in addition to a lengthy permitting process, has resulted in a bottleneck of clean energy projects awaiting approval before they can be plugged into the grid.

This infographic sponsored by the National Public Utilities Council maps U.S. clean energy capacity in interconnection queues by transmission

[...]

Read the full post at Visual Capitalist - Decarbonization.
Previous Story

Upcoming US/UK Fossil Fuel Protests. And G20 $1.4T PER YEAR Fossil Fuel Subsidies.

Next Story

Are humans really behind the extra CO2 in the atmosphere?